Equipment utilization monitoring system
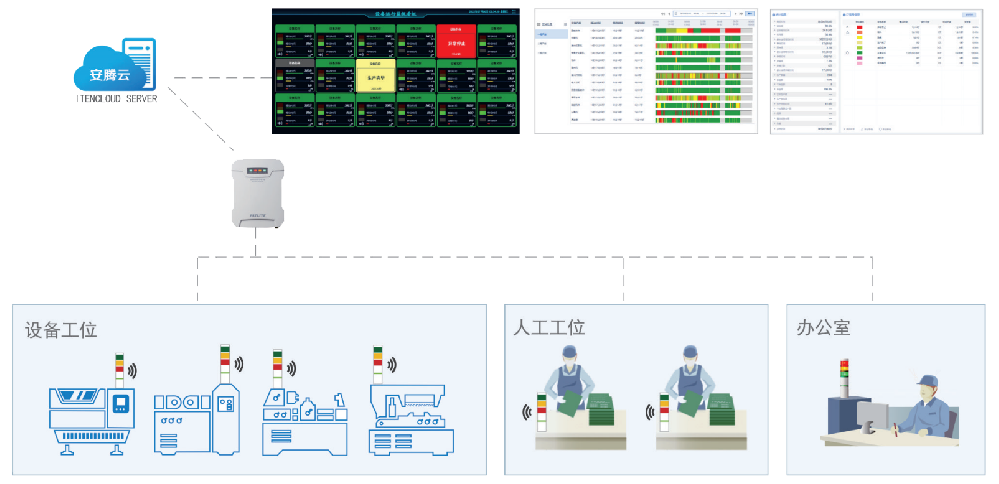
By using signal acquisition devices automatically collecting data from tri-color lights, ITENCloud equipment utilization monitoring system could monitor equipment status and analyze statistics about OEE and other data. What's unique about ITENCloud equipment utilization monitoring system is, it can integrate workplaces with just manual works into the system, regardless of the year of manufacture and manufacturers, all equipment can be connected to the network, to ensure comprehensive and rapid control of the production process, obtain equipment (workplaces) status at any time, monitor employee performance in real time, improve equipment utilization rate and keep factory operating efficiently at all times.
Function Introduction
Real time monitoring of device operation status, Quick response to production events, "Simple" IoT collects shopfloor data, realizing visual management of production sites,quick response, efficient collaboration and improving efficiency. At any time, the factory situation is clear at a glance.

Signal Acquisition
- Zero modification, no wiring, suitable for different models
- Utilization, shutdown, production counting signals and loss reasons, production plan data collection

Utilization Monitoring
- Real time monitoring of equipment status and production status
- Customizable configuration for each large screen dashboard, displaying data for each equipment.

Events Notification
- Timely notification about equipment status and on-site events
- Supports multiple methods such as mobile phones, industrial bracelets, emails, and notification lights

Statistical analysis
- Automatically gathering statistics about Equipment utilization rate and OEE .
- Automatic generating equipment daily/weekly/monthly reports, loss analysis, and equipment utilization log tracking.
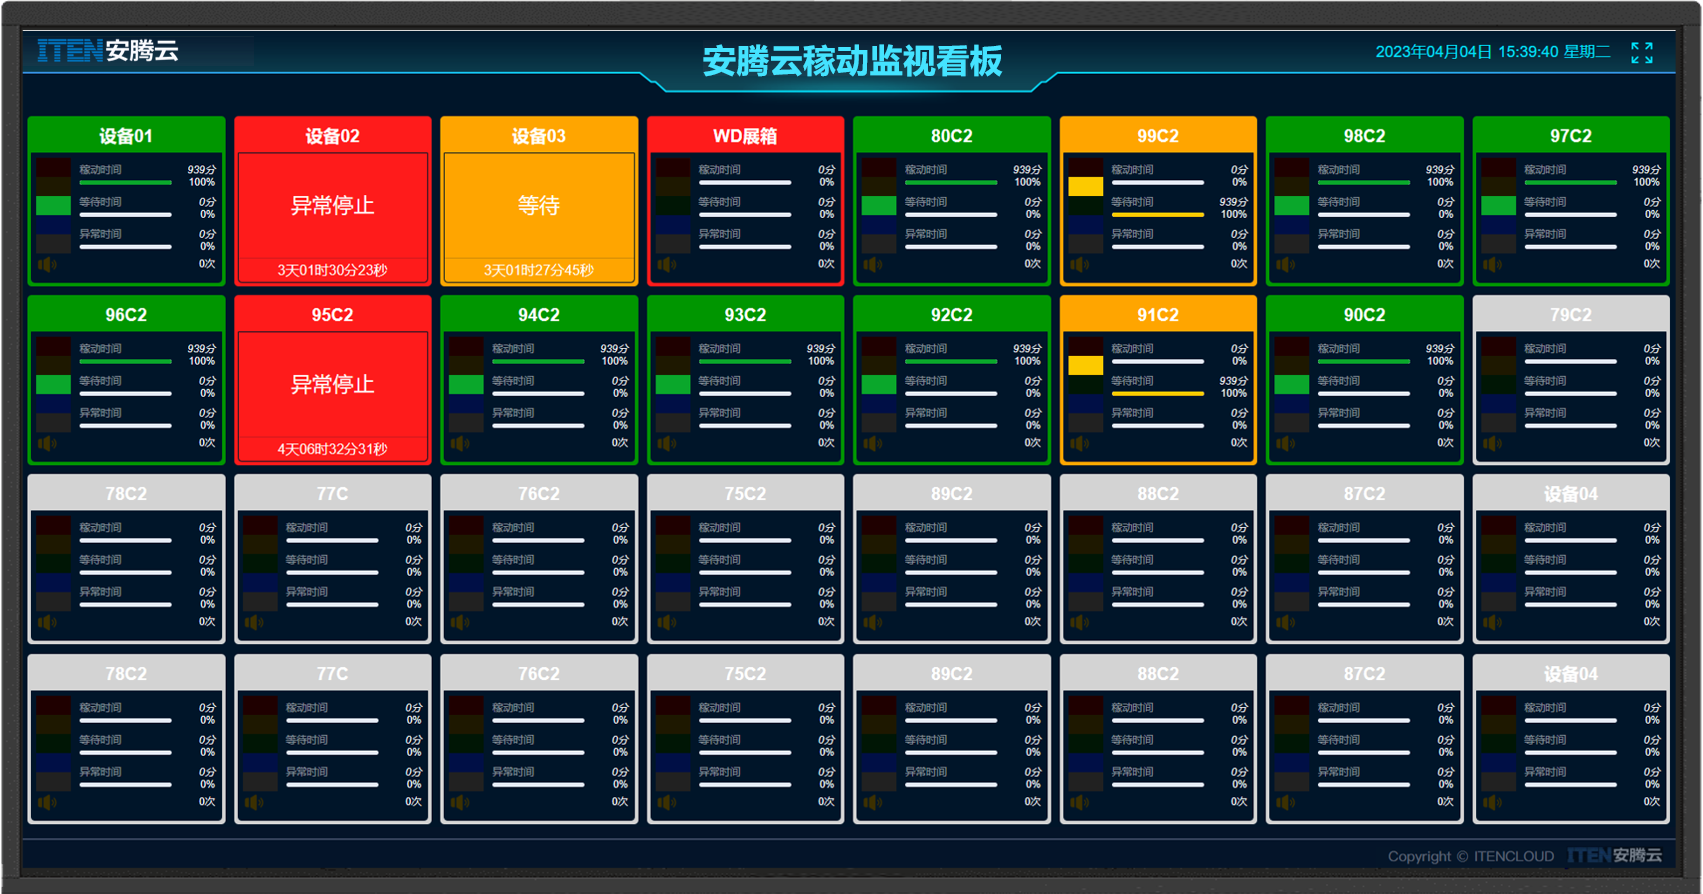
Utilization onitoring
- Real time monitoring equipment status, synchronized displayed on the dashboard, visualizing current equipment operation status
- Real time display of the daily (shift) running time, waiting time, and stopping time (frequency) of each equipment
- The system also can display the production counts of each equipment by using counting function
- Emphasis displaying abnormal events information, easily implementing Andon
- Support login on electronic big screens, smart TVs, mobile phones, and computers
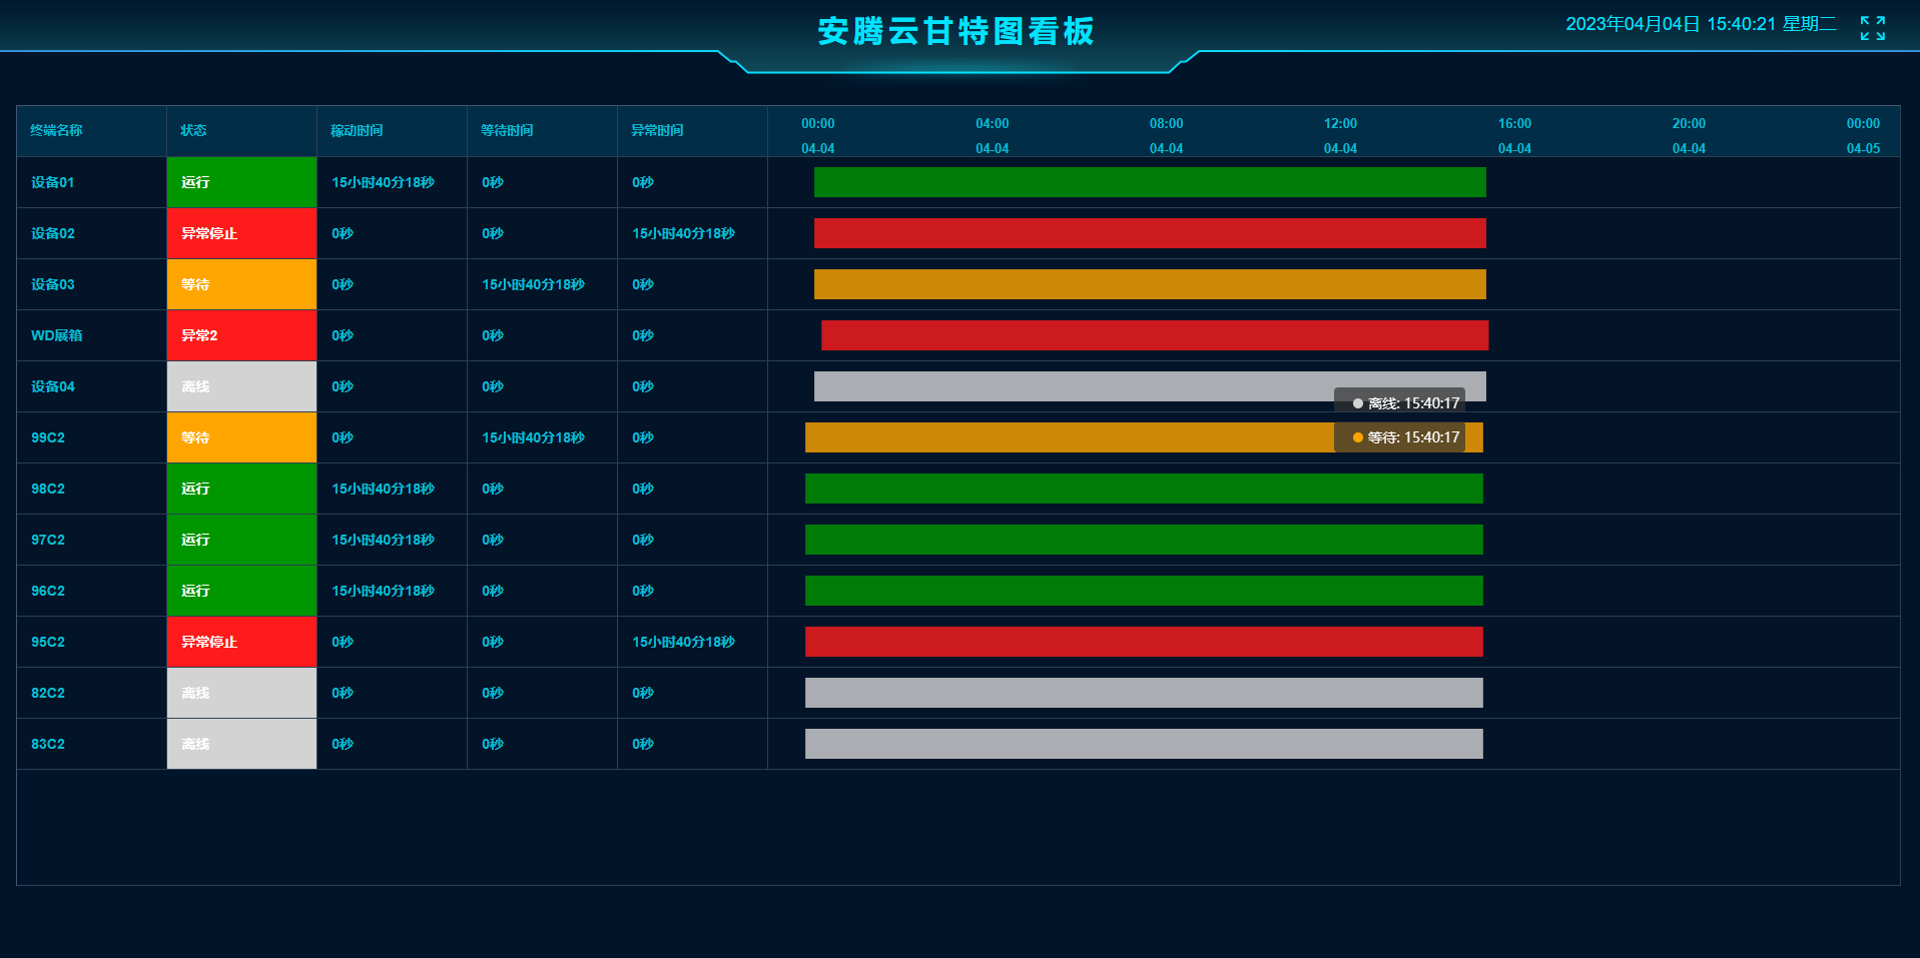
Equipment Utilization records
- Recording full process equipment's operation status, represented in the form of a Gantt chart, visualizing the status in an intuitive way.
- Detailed records of equipment waiting and failure frequency, support searching by different time units
- The counting function allows you to understand the relationship between the number of production units and the running/stop signals in each period, providing support for improvement.
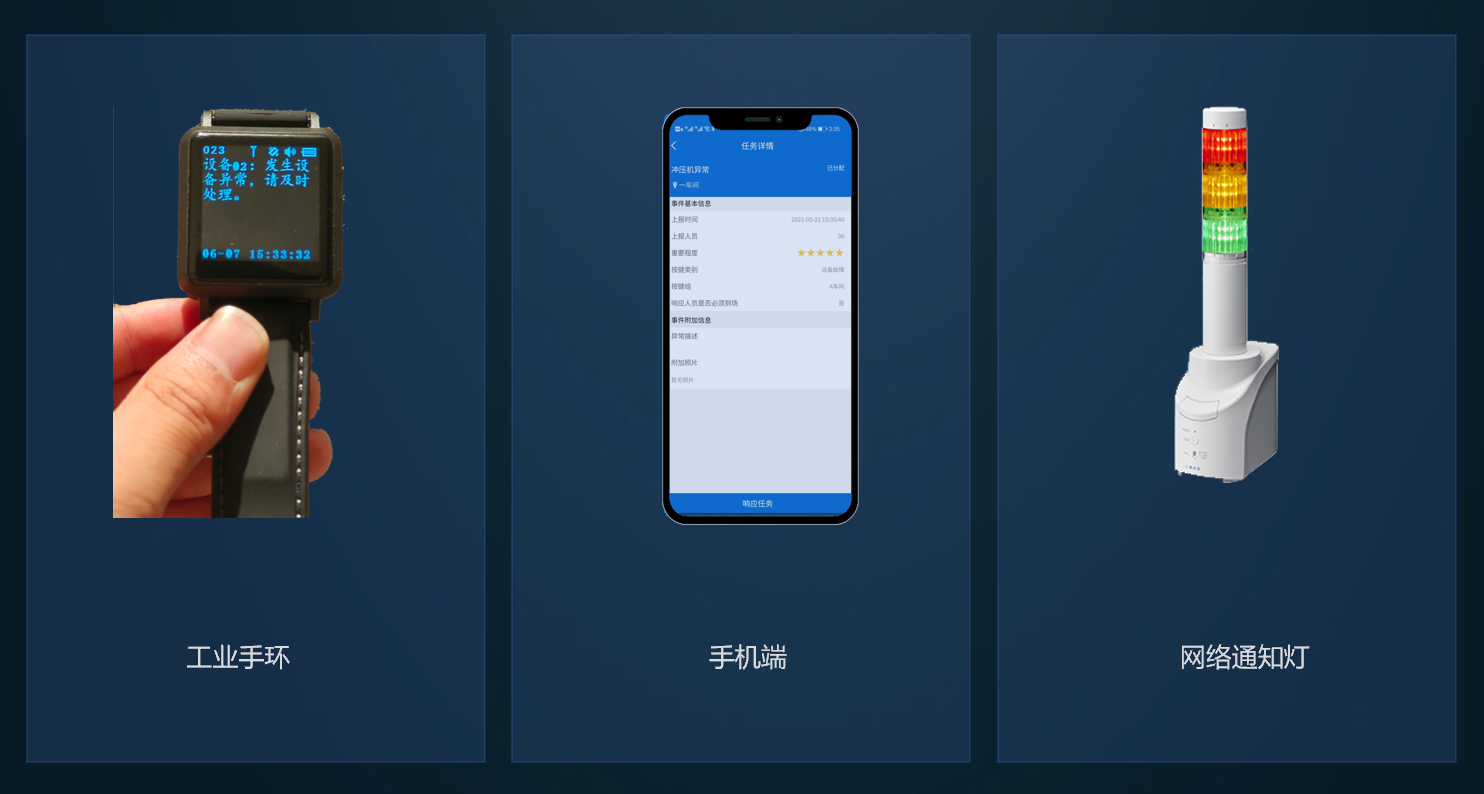
Events Notification
- Specify event notifications for the occurrence or recovery of equipment abnormal events, automatically sends notifications through mobile phones, industrial bracelets, emails, and signal lights
- Individual settings can be made for each equipment and different notification methods can be set for each equipment's status or events
- Support escalation notifications for different event durations. For example, notifying the shopfloor team leader after 5 minutes and the supervisor after 30 minutes
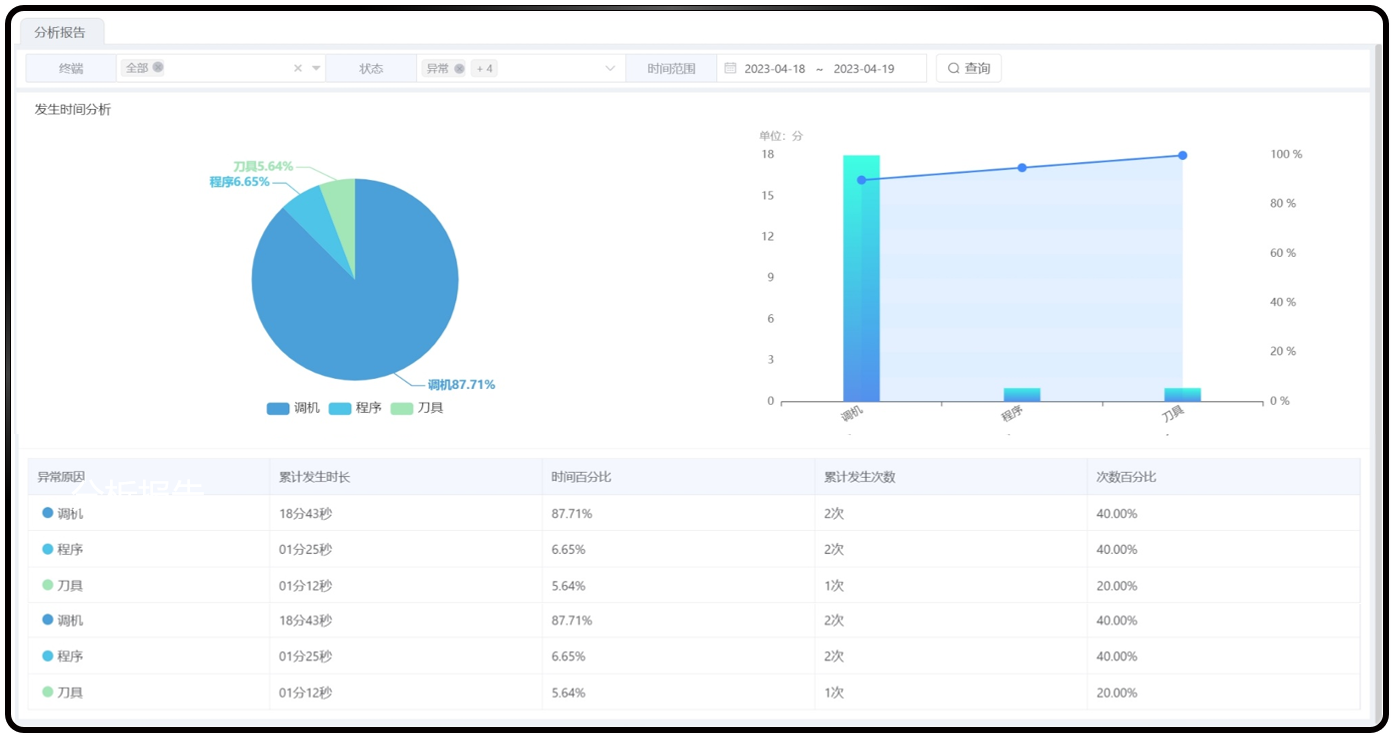
Causes of losses analysis
- Quickly enter the causes of losses when the malfunction occurring, the system automatically collects the time of loss and the abnormal events frequencies.
- Quickly recording of on-site rest loss, stop loss, performance loss, quality loss
- Automatically generate comprehensive daily reports and analysis reports on the causes of losses.

Production Schedule
- Set or import production schedule data and other ancillary basic data.
- Scan the QR code on site to collect information on schedule, personnel, machines, materials, etc. The system automatically generates detailed production records and analysis reports for the production schedule.
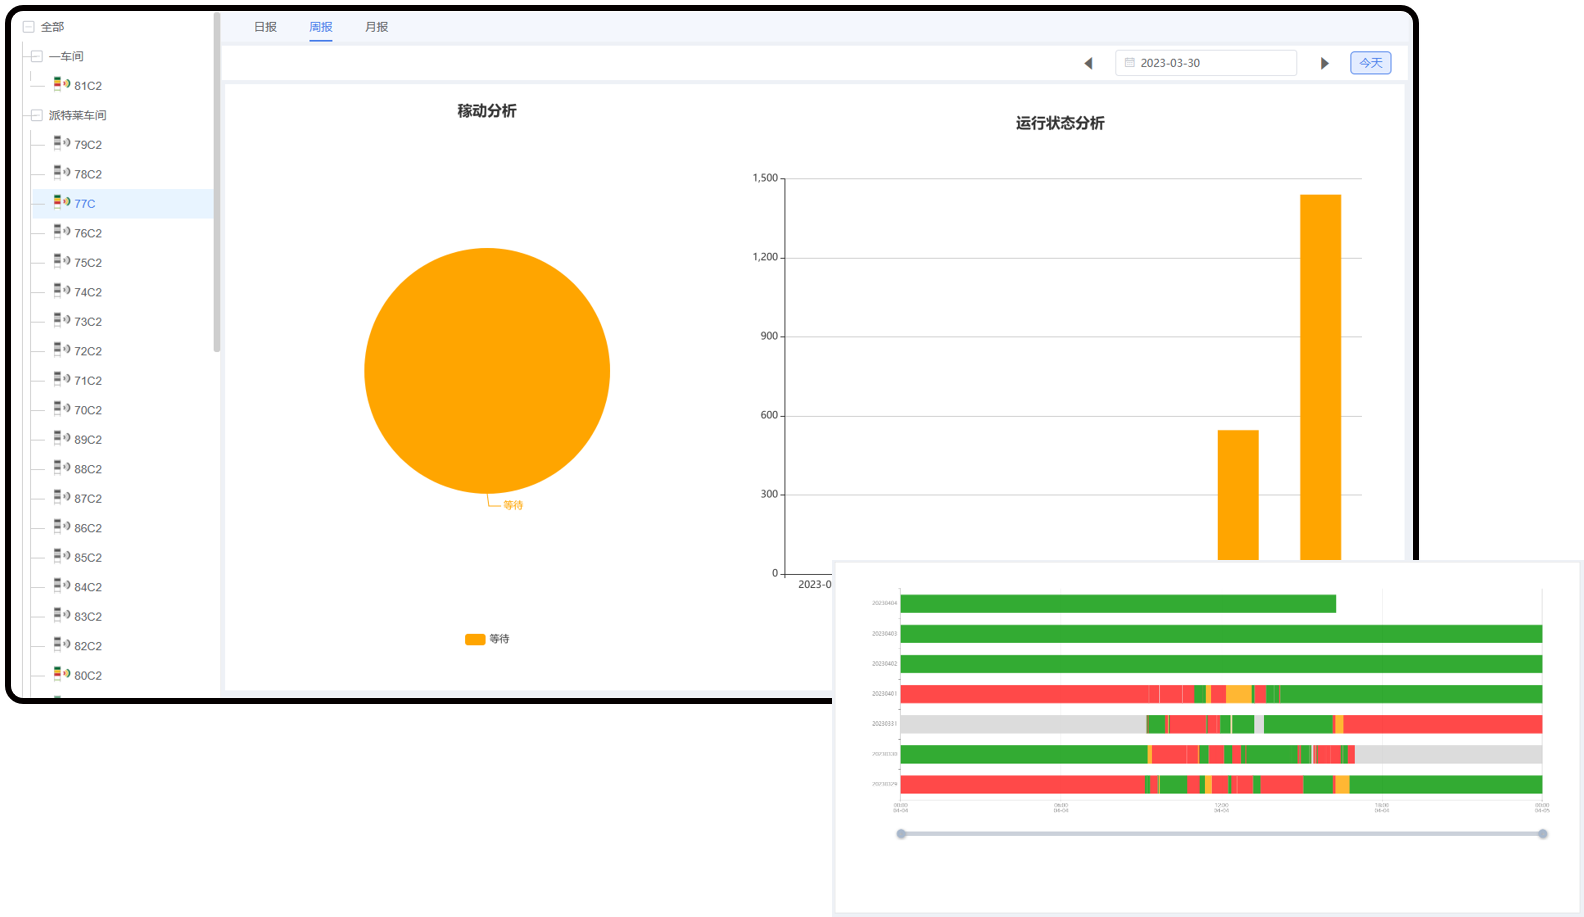
Operation analysis
- Automatically summarize and manage daily operation status, supporting collaborative daily analysis.
- Automatically generate daily, weekly, and monthly reports, equipment utilization log and equipment operation analysis.
- Statistical analysis can be conducted at different time periods based on individual terminals, regions, shopfloor, production lines, forming intuitive analysis reports.
Application Value

Real time monitoring equipment operation status
Intelligent reporting reasons for abnormal events losses

Visual management of operation records